
Gantt Charts
July 15th, 2024 - 8-9 minutes read
1. Introduction
Gantt charts are essential tools in project management, providing a visual representation of project schedules and timelines. Named after their inventor, Henry L. Gantt, these charts have become synonymous with project planning and are widely used across various industries. This guide will delve deeply into the history, structure, benefits, applications, and best practices associated with Gantt charts, offering practical insights for effectively creating and using them.
2. History of Gantt Charts
The Origins of Project Management
Project management as a formal discipline began to take shape in the early 20th century. Before the advent of modern project management techniques, projects were often managed using ad-hoc methods that lacked standardization and formal structure. The need for more systematic approaches to managing complex projects led to the development of various tools and techniques, including the Gantt chart.
Henry L. Gantt: The Innovator
Henry Laurence Gantt (1861-1919) was an American mechanical engineer and management consultant who is best known for creating the Gantt chart. Gantt’s contributions to management theory were driven by his desire to improve industrial efficiency and worker productivity. In the early 1910s, Gantt introduced his eponymous chart as a visual tool to help managers plan, schedule, and track tasks within a project. His work laid the foundation for modern project management and established the Gantt chart as an invaluable tool for project planning.
Evolution of Gantt Charts
Since their inception, Gantt charts have evolved significantly. Originally created using pen and paper, these charts were static and required manual updates. With the advent of computers and project management software, Gantt charts became dynamic and more accessible. Modern Gantt chart tools offer advanced features such as drag-and-drop scheduling, real-time updates, resource management, and integration with other project management methodologies. This evolution has made Gantt charts more powerful and easier to use, cementing their place in contemporary project management.
3. Structure of a Gantt Chart
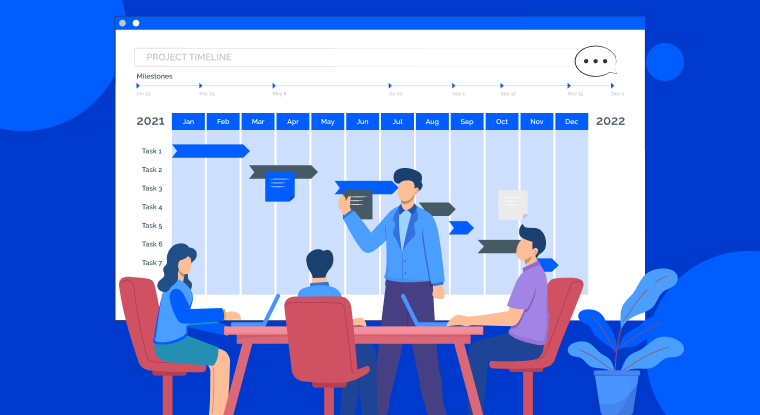
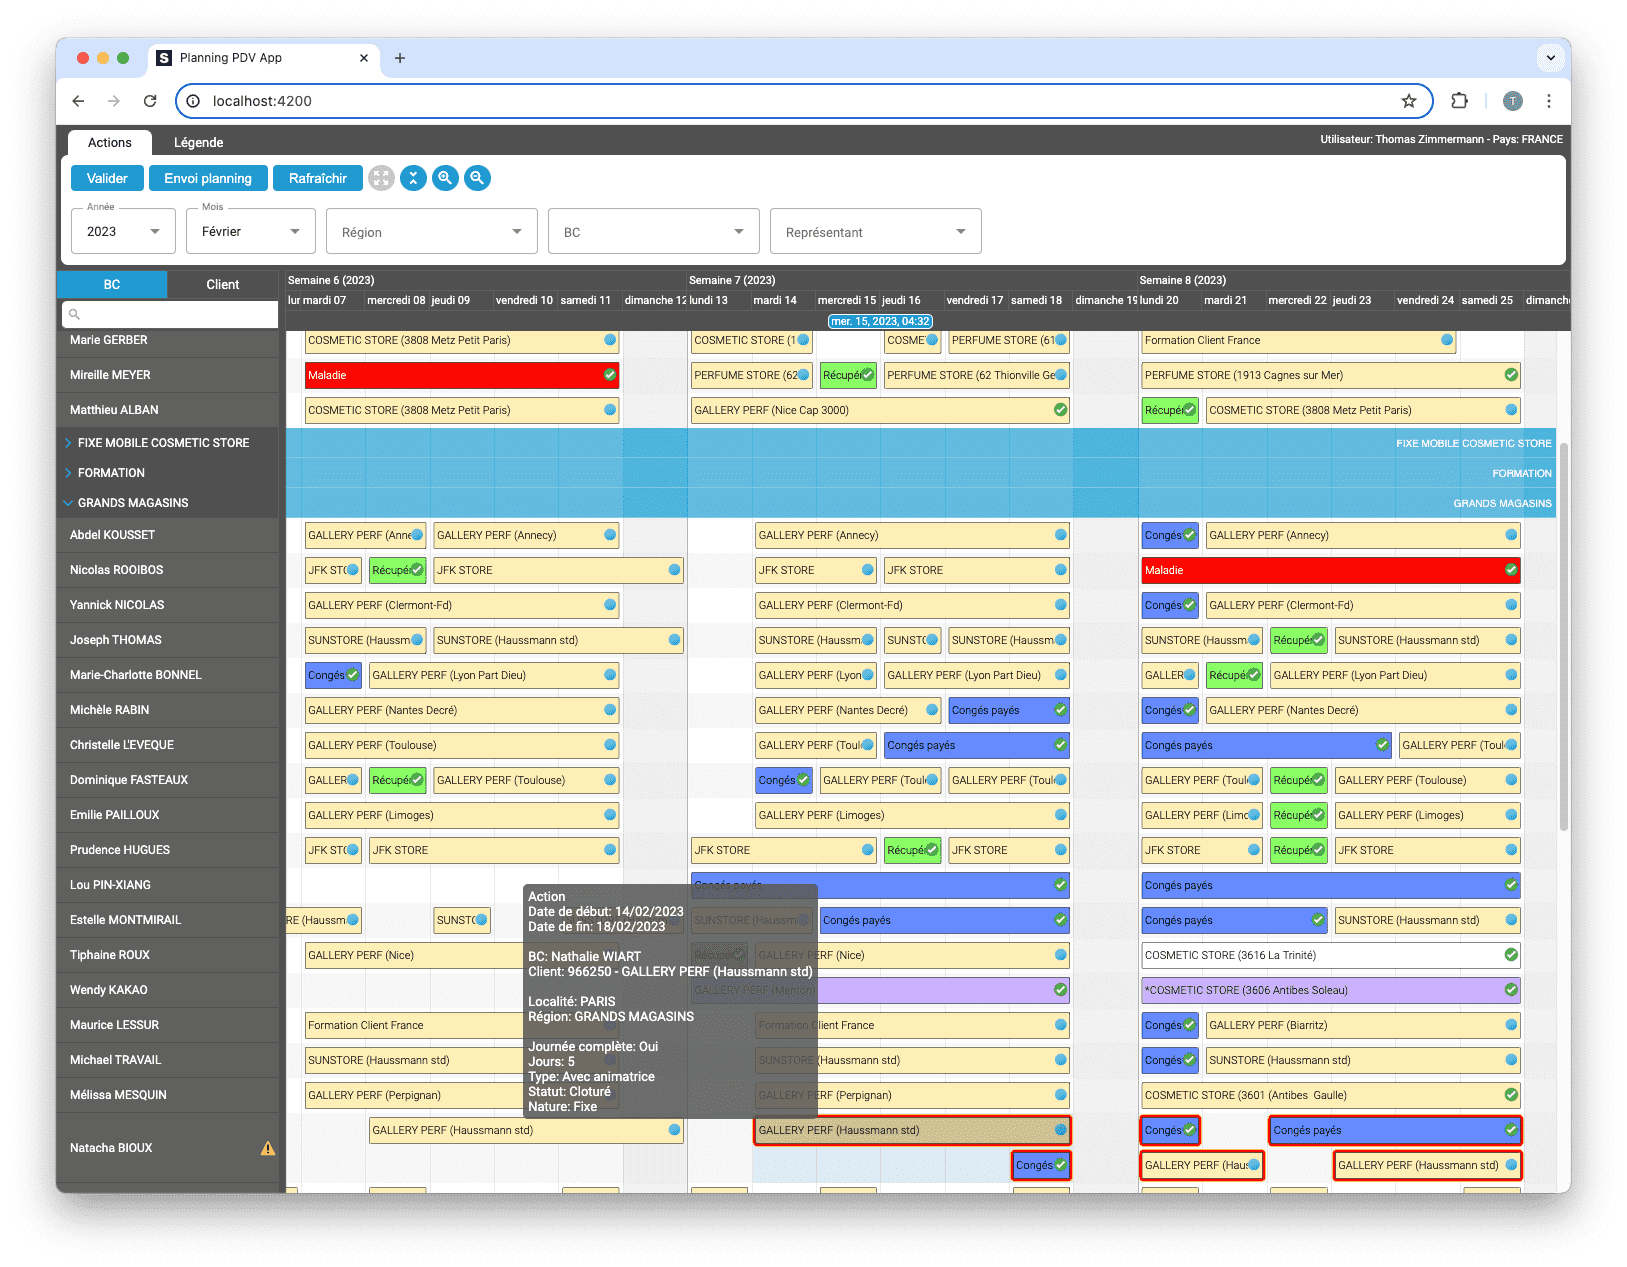
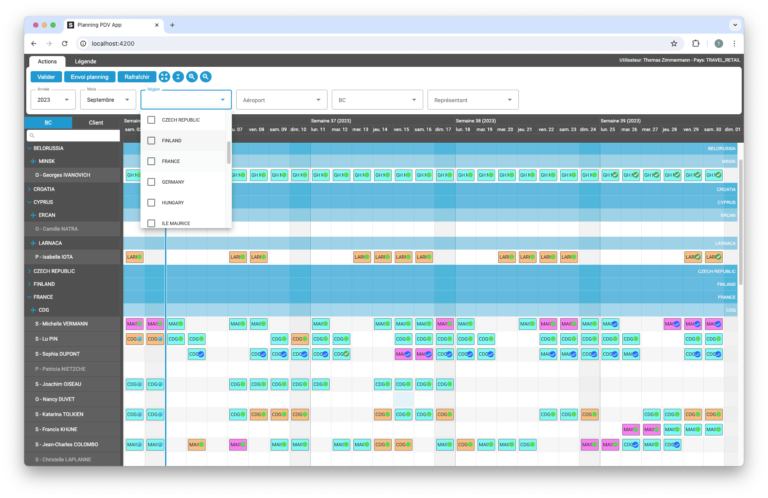
A Gantt chart consists of two primary sections: the task list and the timeline. Understanding the structure and components of a Gantt chart is crucial for effective project management.
Task List
The task list is typically located on the left side of the Gantt chart. It includes all the activities or tasks required to complete the project. Each task is listed with a name and, in some cases, a unique identifier. The task list may also include additional information such as task descriptions, assigned resources, and priority levels.
Timeline
The timeline runs horizontally across the top of the chart, representing the project’s duration. It is divided into equal intervals, such as days, weeks, or months, depending on the project’s length and complexity. Each task is represented by a horizontal bar that spans the time period during which the task is expected to be completed. The position and length of the bar indicate the task’s start and end dates.
Components of a Gantt Chart
Several key components are essential to understanding and using Gantt charts effectively:
- Tasks and Subtasks: These represent the individual activities that need to be completed. Tasks can be broken down into subtasks to provide more detailed insights into the project.
- Dependencies: Dependencies indicate relationships between tasks. A dependency shows that one task must be completed before another can start, helping to identify the sequence of activities. Common types of dependencies include finish-to-start (FS), start-to-start (SS), finish-to-finish (FF), and start-to-finish (SF).
- Milestones: Significant events or points in the project timeline are marked as milestones. They represent critical deadlines or the completion of major phases. Milestones are typically depicted as diamond-shaped symbols on the Gantt chart.
- Progress Indicators: Progress indicators show the current status of each task, allowing project managers to track progress and identify any delays. These indicators can be visualized as shaded portions of the task bars or as percentage completions.
- Resource Assignments: Resource assignments link specific team members, equipment, or materials to tasks. This helps ensure that resources are allocated efficiently and that team members are aware of their responsibilities.
4. Benefits of Gantt Charts
Gantt charts offer numerous benefits for project managers and teams. These advantages stem from their ability to provide a clear, visual representation of project timelines and tasks.
Visualization
One of the primary benefits of Gantt charts is their ability to visualize complex project schedules. By presenting tasks and timelines in a graphical format, Gantt charts make it easier to understand the sequence of activities, identify potential conflicts, and ensure that all tasks are accounted for.
Planning and Scheduling
Gantt charts help in planning and scheduling tasks efficiently. They allow project managers to establish start and end dates for each task, allocate resources, and ensure that all activities are coordinated. This structured approach to planning helps prevent overlaps and ensures that deadlines are met.
Gestion des ressources
Effective resource management is crucial for project success. Gantt charts provide a visual overview of resource allocation, helping project managers ensure that team members, equipment, and materials are used efficiently. By identifying potential resource conflicts and adjusting schedules accordingly, Gantt charts help optimize resource utilization.
Communication
Gantt charts serve as a powerful communication tool, providing a common reference point for project stakeholders. They help convey project plans, timelines, and progress in a clear and understandable format. This fosters better collaboration and ensures that everyone is aligned with the project objectives.
Tracking and Monitoring
Gantt charts enable ongoing tracking and monitoring of project progress. By regularly updating the chart to reflect the current status of tasks, project managers can identify any delays or issues early on and take corrective actions. This proactive approach helps keep projects on track and ensures timely delivery.

5. Applications of Gantt Charts
Gantt charts are versatile and can be used in various industries and contexts. Here are some common applications of Gantt charts:
Construction
In construction projects, Gantt charts are used to plan and coordinate different phases, such as design, procurement, and construction. They help ensure that timelines are met, resources are allocated efficiently, and potential conflicts are identified and resolved.
Software Development
In software development, Gantt charts assist in planning and tracking development cycles, managing sprints, and ensuring that deadlines for feature releases are met. They help coordinate the efforts of development teams, testers, and other stakeholders.
Event Planning
Event planners use Gantt charts to organize tasks such as venue booking, catering, marketing, and logistics. By visualizing the timeline and dependencies, event planners can ensure that all aspects of the event are managed within the specified timeframe.
Manufacturing
In manufacturing, Gantt charts help in scheduling production processes, managing supply chains, and coordinating various stages of product development. They provide a clear overview of the production timeline and help identify potential bottlenecks.
Marketing Campaigns
Marketing teams use Gantt charts to plan and execute campaigns, tracking activities such as content creation, social media posting, and advertising. Gantt charts ensure that all tasks are completed on time and that campaigns are launched successfully.
Research and Development
In research and development (R&D) projects, Gantt charts help manage the complex process of innovation. They assist in planning experiments, coordinating research activities, and tracking progress toward project milestones.
Education and Academia
In educational settings, Gantt charts are used to plan and manage academic projects, research, and coursework. They help students and educators organize their tasks, meet deadlines, and achieve academic goals.
6. Creating a Gantt Chart
Creating a Gantt chart involves several steps. By following a structured approach, project managers can ensure that their Gantt charts are accurate and effective.
Define the Project Scope
The first step in creating a Gantt chart is to define the project scope. This involves clearly outlining the project’s objectives, deliverables, and key milestones. Understanding the scope is essential for identifying all the tasks required to complete the project.
Identify Tasks and Subtasks
Next, break down the project into manageable tasks and subtasks. Each task should have a clear objective and timeline. Group related tasks into phases or categories to provide a logical structure to the project.
Determine Dependencies
Identify relationships between tasks and establish dependencies. This ensures that the sequence of activities is logical and efficient. Common types of dependencies include:
- Finish-to-Start (FS): Task B cannot start until Task A is finished.
- Start-to-Start (SS): Task B cannot start until Task A starts.
- Finish-to-Finish (FF): Task B cannot finish until Task A finishes.
- Start-to-Finish (SF): Task B cannot finish until Task A starts.
Assign Resources
Allocate resources, including team members, equipment, and materials, to each task. Ensure that resources are utilized effectively and that team members are aware of their responsibilities.
Set Deadlines
Establish start and end dates for each task, taking into account dependencies and resource availability. Set realistic deadlines to ensure that tasks are completed on time.
Create the Chart
Use software or a spreadsheet to create the Gantt chart. Input tasks, dependencies, and timelines into the chart. Many project management tools, such as Microsoft Project, Trello, and Asana, offer built-in Gantt chart functionalities that streamline this process.
Monitor and Update
Regularly update the Gantt chart to reflect progress and any changes in the project scope or timeline. This ensures that the chart remains an accurate representation of the project’s status. Monitor task completion, update progress indicators, and adjust timelines as needed.
7. Best Practices for Using Gantt Charts
To maximize the effectiveness of Gantt charts, consider the following best practices:
Keep It Simple
Avoid overcomplicating the chart with too many details. Focus on key tasks, milestones, and dependencies to maintain clarity. A simple and straightforward Gantt chart is easier to manage and understand.
Regular Updates
Keep the chart up-to-date to ensure that it accurately reflects the project’s current status. Regularly review and adjust timelines, tasks, and resources as needed. Frequent updates help identify potential issues early and ensure timely interventions.
Engage the Team
Involve team members in the creation and updating of the Gantt chart. This fosters ownership and ensures that everyone is aware of their responsibilities and deadlines. Collaborative planning helps build a shared understanding of the project objectives.
Use Milestones
Mark significant events and deadlines as milestones to highlight critical points in the project timeline. Milestones help track progress and provide a clear indication of important achievements.
Monitor Dependencies
Pay close attention to task dependencies to avoid delays and ensure that tasks are completed in the correct sequence. Properly managing dependencies is crucial for maintaining the project schedule.
Communicate Progress
Use the Gantt chart as a communication tool to keep stakeholders informed about the project’s progress and any potential issues. Regularly share updates and discuss the status of tasks and milestones with the project team.
Leverage Software
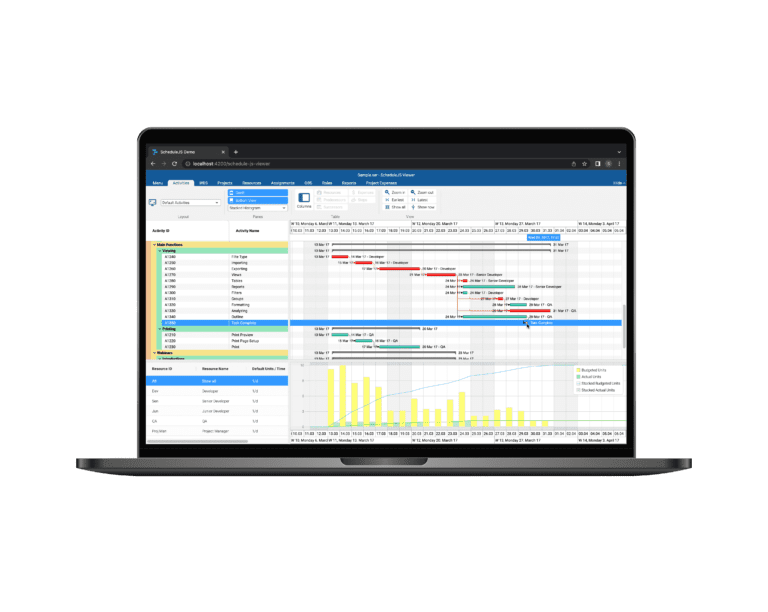
Utilize project management software with Gantt chart functionalities to streamline the creation and management of the chart. These tools often offer additional features, such as task assignment, time tracking, and reporting, which enhance project management capabilities.
8. Common Challenges and How to Overcome Them
While Gantt charts are valuable tools, they can present some challenges. Here are common challenges and strategies for overcoming them:
Complexity
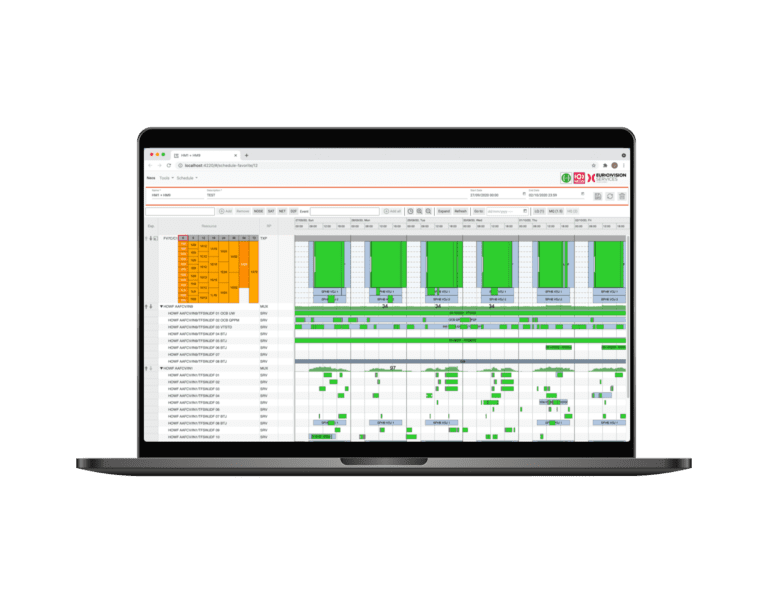
Large projects with many tasks and dependencies can make Gantt charts complex and difficult to manage. To overcome this, break down the project into phases or smaller components and create separate Gantt charts for each phase. This approach simplifies the chart and makes it more manageable.
Time-Consuming Updates
Manually updating Gantt charts can be time-consuming, especially for large projects. Using project management software can automate updates and reduce the effort required to maintain the chart. Automation ensures that the chart is always up-to-date and accurate.
Resource Constraints
Allocating resources effectively can be challenging, especially when multiple projects compete for the same resources. Prioritize tasks, adjust timelines, and consider resource leveling techniques to address this issue. Resource leveling involves adjusting the project schedule to balance resource demand and availability.
Inflexibility
Gantt charts can become rigid and less useful if the project scope or timeline changes frequently. To mitigate this, build flexibility into the chart by allowing for adjustments and regularly reviewing the project plan. Agile project management techniques, such as iterative planning and continuous feedback, can help accommodate changes more effectively.
Limited Detail
Gantt charts provide a high-level overview of the project schedule but may lack detailed information about individual tasks. To address this, supplement the Gantt chart with additional documentation, such as task descriptions, checklists, and detailed project plans. This provides a more comprehensive view of the project.
Communication Gaps
Miscommunication can occur if stakeholders do not understand the Gantt chart or if updates are not shared regularly. To bridge communication gaps, provide training on how to read and interpret Gantt charts, and establish regular communication channels for sharing updates and discussing progress.
9. Advanced Features and Techniques
Modern project management software offers advanced features and techniques that enhance the functionality of Gantt charts. Here are some advanced features and techniques to consider:
Baselines
A baseline is a snapshot of the project schedule at a specific point in time. Baselines allow project managers to compare the current schedule with the original plan and measure deviations. This helps track project performance and identify areas that require corrective actions.
Critical Path Method (CPM)
The Critical Path Method (CPM) is a technique used to identify the longest sequence of tasks that must be completed on time for the project to be finished by the deadline. The critical path represents the shortest possible project duration. Identifying the critical path helps prioritize tasks and allocate resources effectively.
Earned Value Management (EVM)
Earned Value Management (EVM) is a project management technique that integrates scope, schedule, and cost to measure project performance. EVM provides key metrics, such as Earned Value (EV), Planned Value (PV), and Actual Cost (AC), which help assess project health and forecast future performance.
Resource Leveling
Resource leveling is the process of adjusting the project schedule to balance resource demand and availability. This technique helps avoid resource overallocation and ensures that resources are used efficiently. Resource leveling may involve delaying tasks, extending the project timeline, or reallocating resources.
Agile Gantt Charts
Agile project management methodologies, such as Scrum and Kanban, emphasize flexibility and iterative planning. Agile Gantt charts combine the principles of Agile with the visual representation of Gantt charts. They allow for iterative planning, frequent updates, and continuous feedback, making them suitable for dynamic and evolving projects.
Integration with Other Tools
Modern project management software often integrates with other tools, such as time tracking systems, communication platforms, and document management systems. Integration enhances collaboration, streamlines workflows, and provides a unified view of project information.
10. Case Studies and Examples
Examining real-world case studies and examples can provide valuable insights into the practical application of Gantt charts. Here are some examples of how Gantt charts have been used in different industries:
Case Study 1: Construction Project
Project Overview: A construction company was tasked with building a new office complex. The project involved multiple phases, including site preparation, foundation work, structural construction, and interior finishing.
Challenges: The project faced challenges related to resource allocation, timeline management, and coordination among different subcontractors.
Solution: The project manager created a Gantt chart to visualize the entire project timeline. The chart included detailed tasks, dependencies, and milestones for each phase. Resource assignments were clearly indicated, and regular updates were made to reflect progress.
Outcome: The Gantt chart helped the project manager coordinate activities, allocate resources efficiently, and ensure that deadlines were met. The project was completed on time and within budget.
Case Study 2: Software Development Project
Project Overview: A software development company was developing a new mobile application. The project involved multiple development sprints, testing phases, and feature releases.
Challenges: The project faced challenges related to coordinating the efforts of development teams, managing dependencies, and ensuring timely feature releases.
Solution: The project manager used a Gantt chart to plan and track the development cycles. The chart included tasks for each sprint, dependencies between tasks, and milestones for feature releases. Progress indicators were used to track the status of each task.
Outcome: The Gantt chart provided a clear overview of the project timeline and helped the project manager coordinate the efforts of the development teams. The application was released on schedule, and the project was deemed a success.
Case Study 3: Marketing Campaign
Project Overview: A marketing agency was planning a comprehensive marketing campaign for a new product launch. The campaign included activities such as content creation, social media posting, and advertising.
Challenges: The project faced challenges related to coordinating various marketing activities, managing deadlines, and ensuring consistent messaging.
Solution: The project manager created a Gantt chart to organize the marketing activities. The chart included tasks for content creation, social media posting, and advertising, along with their respective deadlines and dependencies. Milestones were set for key campaign events.
Outcome: The Gantt chart helped the project manager ensure that all marketing activities were completed on time and that the campaign was launched successfully. The campaign achieved its objectives, and the product received positive market reception.
11. Future Trends in Gantt Charts
As project management continues to evolve, Gantt charts are also expected to undergo significant advancements. Here are some future trends in Gantt charts:
AI and Automation
Artificial Intelligence (AI) and automation are expected to play a significant role in the future of Gantt charts. AI algorithms can analyze project data, predict potential issues, and recommend optimal schedules. Automation can streamline updates and reduce the effort required to maintain the chart.
Real-Time Collaboration
Real-time collaboration features are becoming increasingly important in project management tools. Future Gantt charts are expected to offer enhanced collaboration capabilities, allowing team members to work together seamlessly and make real-time updates.
Advanced Analytics
Advanced analytics and data visualization techniques will provide deeper insights into project performance. Future Gantt charts will offer sophisticated reporting features, enabling project managers to analyze trends, identify patterns, and make data-driven decisions.
Integration with Emerging Technologies
Integration with emerging technologies, such as the Internet of Things (IoT) and blockchain, will enhance the functionality of Gantt charts. IoT devices can provide real-time data on resource usage and project progress, while blockchain can ensure data security and transparency.
Customization and Personalization
Future Gantt charts will offer greater customization and personalization options, allowing project managers to tailor the chart to their specific needs. Customizable views, color-coding, and user-defined fields will enhance the usability of Gantt charts.
Mobile Accessibility
As remote work becomes more prevalent, mobile accessibility will be crucial for project management tools. Future Gantt charts will be optimized for mobile devices, enabling project managers to access and update the chart from anywhere.
12. Conclusion
Gantt charts are indispensable tools for project management, offering a visual and structured way to plan, schedule, and monitor projects. By understanding their history, structure, benefits, and applications, and by following best practices for their creation and use, project managers can enhance their ability to deliver successful projects on time and within budget. Whether used in construction, software development, event planning, manufacturing, marketing, or research and development, Gantt charts provide clarity, improve communication, and facilitate effective resource management, ultimately contributing to the achievement of project goals.
13. References
- Gantt, H. L. (1919). Work, Wages, and Profits: Their Influence on the Cost of Living. The Engineering Magazine Company.
- Project Management Institute. (2021). A Guide to the Project Management Body of Knowledge (PMBOK Guide) – Seventh Edition. Project Management Institute.
- Verzuh, E. (2016). The Fast Forward MBA in Project Management. John Wiley & Sons.
- Kerzner, H. (2017). Project Management: A Systems Approach to Planning, Scheduling, and Controlling. John Wiley & Sons.
- Schwalbe, K. (2015). Information Technology Project Management. Cengage Learning.
- Lock, D. (2013). Project Management. Gower Publishing, Ltd.
- Meredith, J. R., & Mantel, S. J. (2011). Project Management: A Managerial Approach. John Wiley & Sons.
- Larson, E. W., & Gray, C. F. (2017). Project Management: The Managerial Process. McGraw-Hill Education.


