Build custom tree tables in ScheduleJS using schedule-info-column-header-cell and schedule-info-column-row-cell components.

Drawing animations in ScheduleJS
ScheduleJS uses the HTML Canvas rendering engine to draw the grid, activities, additional layers and links. This article explains how to design a simple ScheduleJS rendering animation using the HTML Canvas API
Tuesday, May 2nd, 2023 - 4 minutes read
A few words on HTML Canvas
Have you ever been using the Canvas technology before? The canvas element is an HTML container used to draw programmatically using JavaScript at a surprisingly low cost for the browser.
The most significant feature of the canvas element is that its possibilities are endless in terms of design and interactions. The only limit to what’s on the screen is our imagination.
If you want to wrap your head around the canvas element, you can compare it to a blank drawing paper.
According to the MDN web documentation:
MDN: The Canvas API provides a means for drawing graphics via JavaScript and the HTML canvas element. Among other things, it can be used for animation, game graphics, data visualization, photo manipulation, and real-time video processing.
The Canvas API largely focuses on 2D graphics. The WebGL API, which also uses the canvas element, draws hardware-accelerated 2D and 3D graphics.
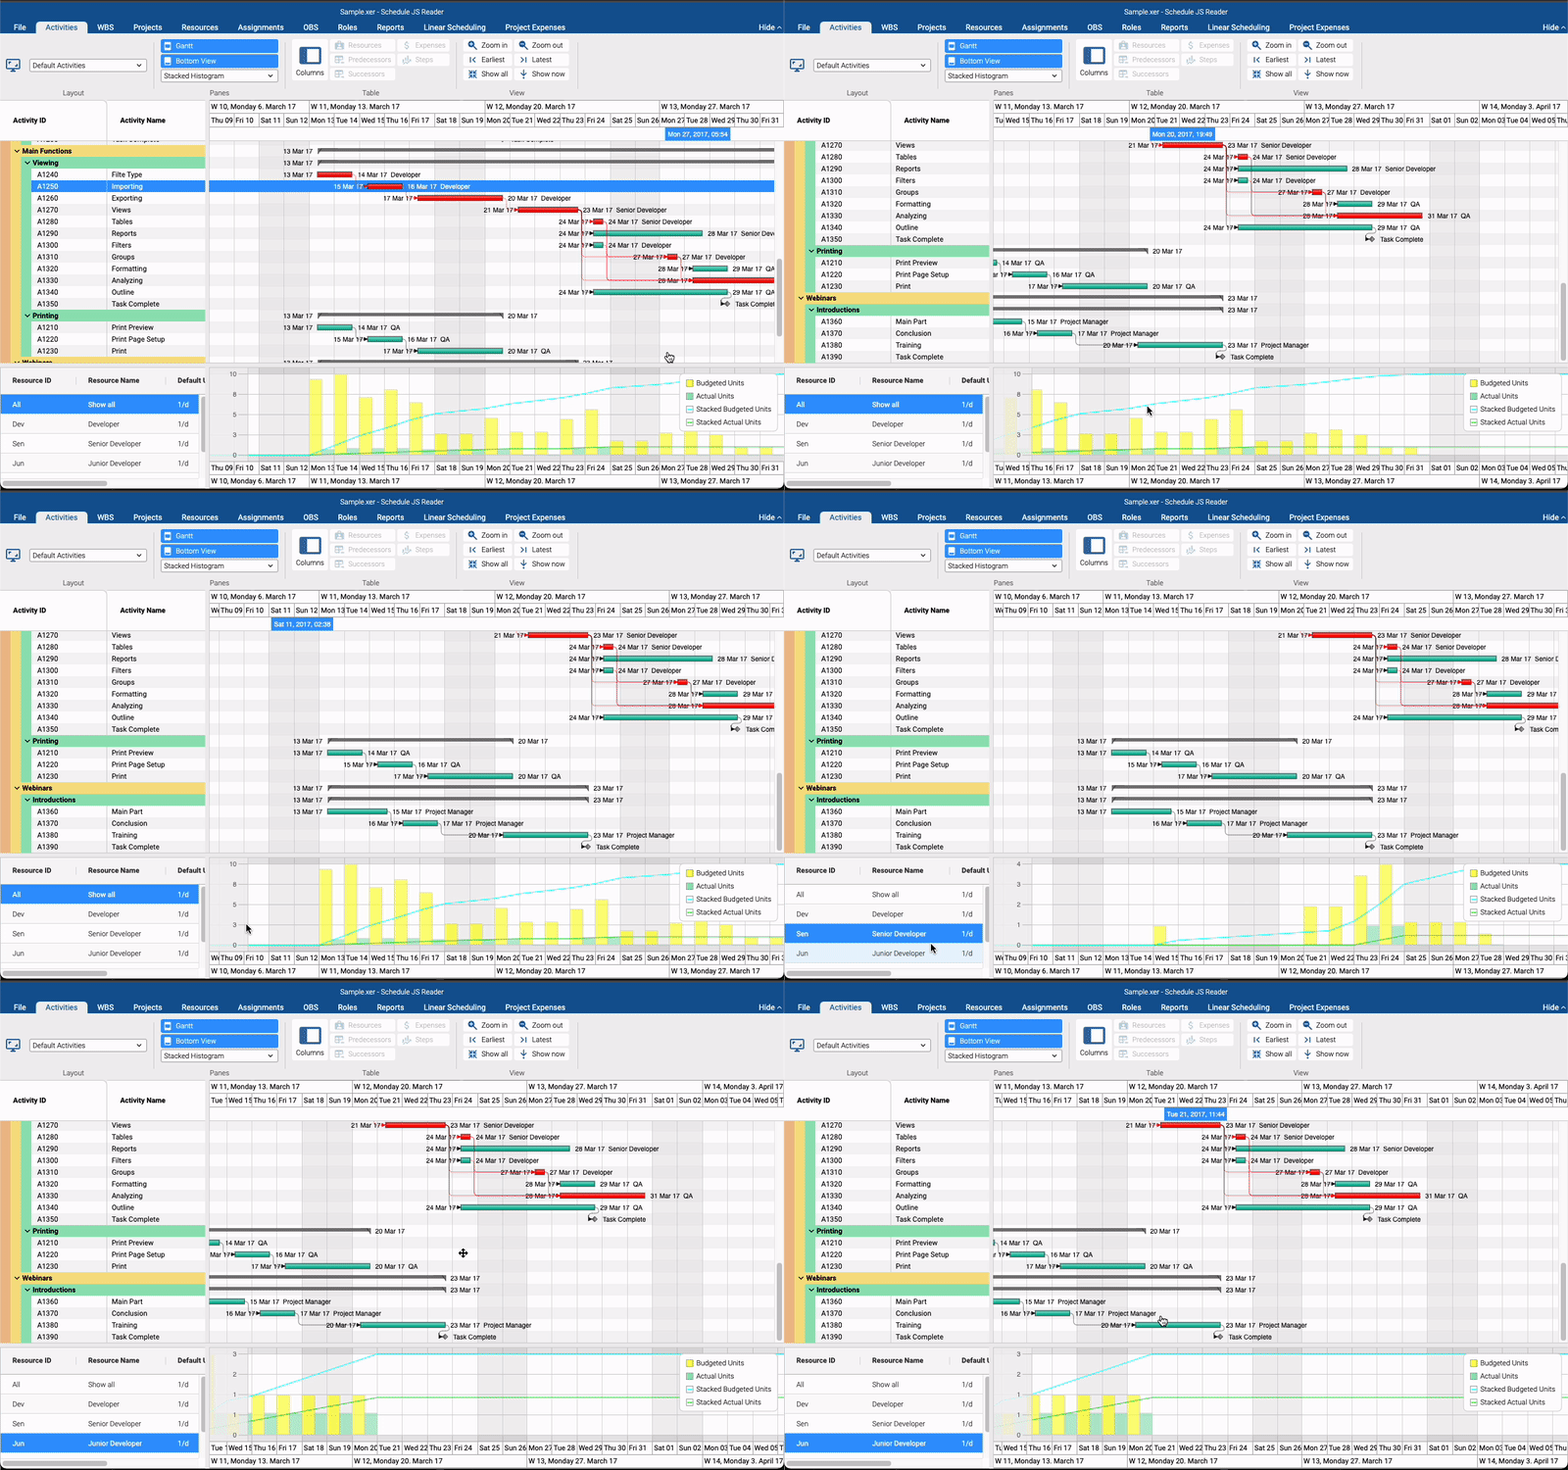
How does ScheduleJS use it?
Once you draw your activities on the canvas, the only way to get it to change is to clean it up and start drawing again.
Under the hood, ScheduleJS implements multiple tools to handle this behavior in the context of a scheduling application. These APIs are sometimes exposed to the developer and sometimes they work silently to let the developer focus on the core features of the application, like the following:
- The System Layers API handle successive drawings and stacking order.
- The Viewport API optimizes the rendering and navigation.
- The Renderer API defines how activities and layers are drawn.
- The Redraw API can be called at will to trigger redraws, operations on the rows, etc…
The most significant item for the developer in this architecture is the ScheduleJS Renderer API. Renderers use overridable functions allowing the developer to create his or her unique way of drawing specific parts of the application:
- The Background
- The Grid
- The Activities
- The Activity Links
- The Drag and Drop layer
- And every additional System Layers
Although this may seem complicated to some people, it is a workflow that developers will get used to quickly. The flexibility of the Renderer architecture and its well-thought implementation allows endless design and interaction scenarios.
Animating your ScheduleJS activities
To animate your Canvas, you have to break down your animation in frames and tell the renderer how to draw each frame. The main ingredient required to create a simple linear animation is the time at which the animation started. If we want to animate every activity on its own, a good place to store this information is the activity data structure.
Let’s create a simple animated renderer to draw every frame based on animation progression. This simple width animation will animate our activity on creation (from 0% width to full-width).
This example focuses on the code required to run the animation. As you can see, we created a ratio (from 0 to 1) describing the duration of our animation and we simply multiply the width by this ratio. As a result, the activity width will expand in a smooth 250ms animation (see below).
More implementation-related articles
Unlock flexible row management in ScheduleJS: control individual row heights, mix GanttLayout and ChartLayout in the same view.
Master drag and drop in ScheduleJS: render activities while dragging, access the drag canvas via DragViewTransversalSystemLayers.
ScheduleJS 1.4 release notes. A step forward towards modern Angular app building.
Angular 16 vs Angular 18 comparison: discover what's new in Angular, the arrival of signals, Zoneless mode, zone coalescing, and their impact on your projects.
Discover the Angular Rome Conference: workshops, domain-driven design, signals, state management, micro frontends.
Discover Angular 18: zoneless mode, zone coalescing, native await, and TypeScript 5.4 compatibility.
The TOP 3 JavaScript Gantt chart. Discover their features, advantages, and disadvantages to choose the best tool for your project.
Discover how ScheduleJS seamlessly integrated with Selligent CRM, enhancing scheduling efficiency for a leading beauty brand's consultants.
This article showcases the integration of a ScheduleJS component into an external Ag-Grid table, to demonstrate the flexibility of ScheduleJS.


