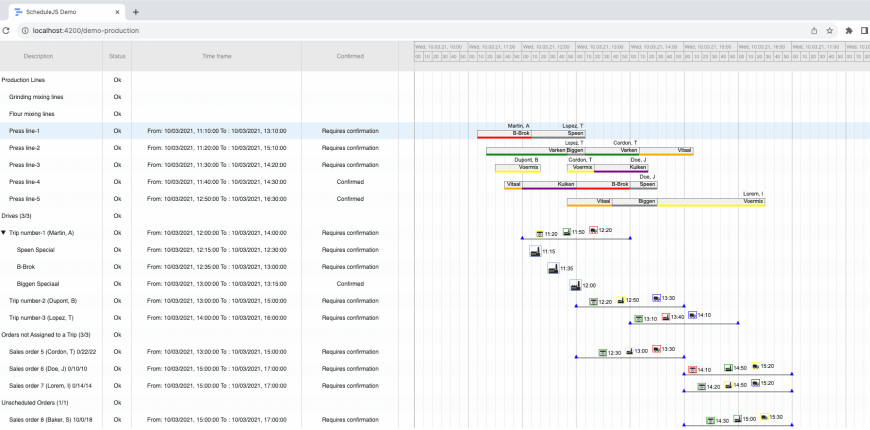
Build custom tree tables in ScheduleJS using schedule-info-column-header-cell and schedule-info-column-row-cell components.
Integrating ScheduleJS into AG-Grid
This article showcases the integration of ScheduleJS in an external third-party table component: the famous AG-Grid. The goal is to demonstrate the flexibility of ScheduleJS when integrated into a table component.
October 9th, 2023 - 3 minutes read
The integration use case
We have identified some cases where companies developing a scheduling component with ScheduleJS already use an in-house or a third-party-developed table. We decided to work on this proof of concept project to demonstrate a scenario where our users opt to leverage their actual solution and make their ScheduleJS application integrate seamlessly into their environment. The key to this approach is to be able to reuse the features a company spent time developing.
An advanced tree table implementation
In ScheduleJS, the tree table is a component often placed at the left of the graphics. Its role is to offer the end-user additional information on a given row and provide tools to interact with the data. ScheduleJS proposes a standard integrated tree table component in which you can customize the column headers and row cells to create the perfect layout for your end users. This standard info-column API aims to empower the developer with a simple yet powerful tool to cover most of the use cases a company can encounter in a scheduling application.
Can we reach the same usability while hosting the ScheduleJS graphics as a child to an external table component?
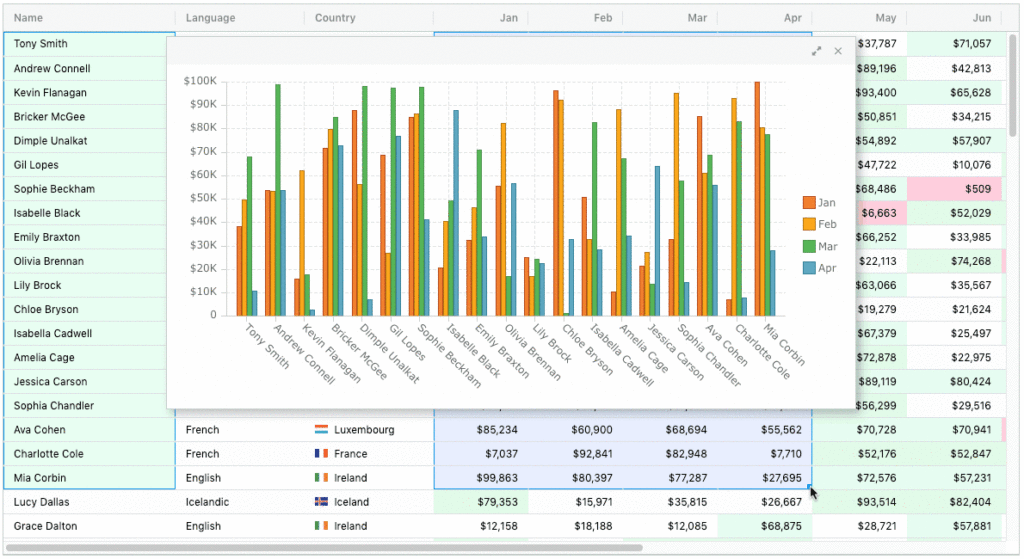
Integrating ScheduleJS as a sub-component
Graphics present complex data into a readable output so the user can quickly gather information and interact with a descriptive graphical view. It is common for a web application to use a table component at the core of its architecture.
AG-Grid has been identified by our developers as a good candidate for this exercise, as a consistent pool of companies use this component to develop their tables.
The following proof of concept couples the AG-Grid out-of-the-box features with the ScheduleJS graphics readability.
The result
For this implementation, we decided to pick the open-source version of the AG-Grid table component, which is royalty-free, even in the event of a commercial project.
The video below shows its features in our development environment:
The resulting additional features compared to a default tree table are the following:
- The option to pin specific columns on the right-most and left-most parts of the ScheduleJS graphics
- The option to modify the horizontal order of any column, including the ScheduleJS graphics
- The ability to resize any column, including the ScheduleJS graphics
- The ability to trigger the row expand and collapse features from the AG-Grid cell
- The ability to use the AG-Grid integrated filter feature, affecting the ScheduleJS graphics
More implementation-related articles
Unlock flexible row management in ScheduleJS: control individual row heights, mix GanttLayout and ChartLayout in the same view.
Master drag and drop in ScheduleJS: render activities while dragging, access the drag canvas via DragViewTransversalSystemLayers.
ScheduleJS 1.4 release notes. A step forward towards modern Angular app building.
Angular 16 vs Angular 18 comparison: discover what's new in Angular, the arrival of signals, Zoneless mode, zone coalescing, and their impact on your projects.
Discover the Angular Rome Conference: workshops, domain-driven design, signals, state management, micro frontends.
Discover Angular 18: zoneless mode, zone coalescing, native await, and TypeScript 5.4 compatibility.
The TOP 3 JavaScript Gantt chart. Discover their features, advantages, and disadvantages to choose the best tool for your project.
Discover how ScheduleJS seamlessly integrated with Selligent CRM, enhancing scheduling efficiency for a leading beauty brand's consultants.
This article showcases the integration of a ScheduleJS component into an external Ag-Grid table, to demonstrate the flexibility of ScheduleJS.








Hello, would you have the link to the source code of this demo?
Hi Jairo,
This integration is made by using the ScheduleJS info column component wrappers. The team will contact you to further discuss this in private.
Thanks,