This article shows how to implement dynamic rendering depending on the current zoom-level of the graphics.


This article will show you how the parent-child tree Gantt architecture within the ScheduleJS Viewer was built.
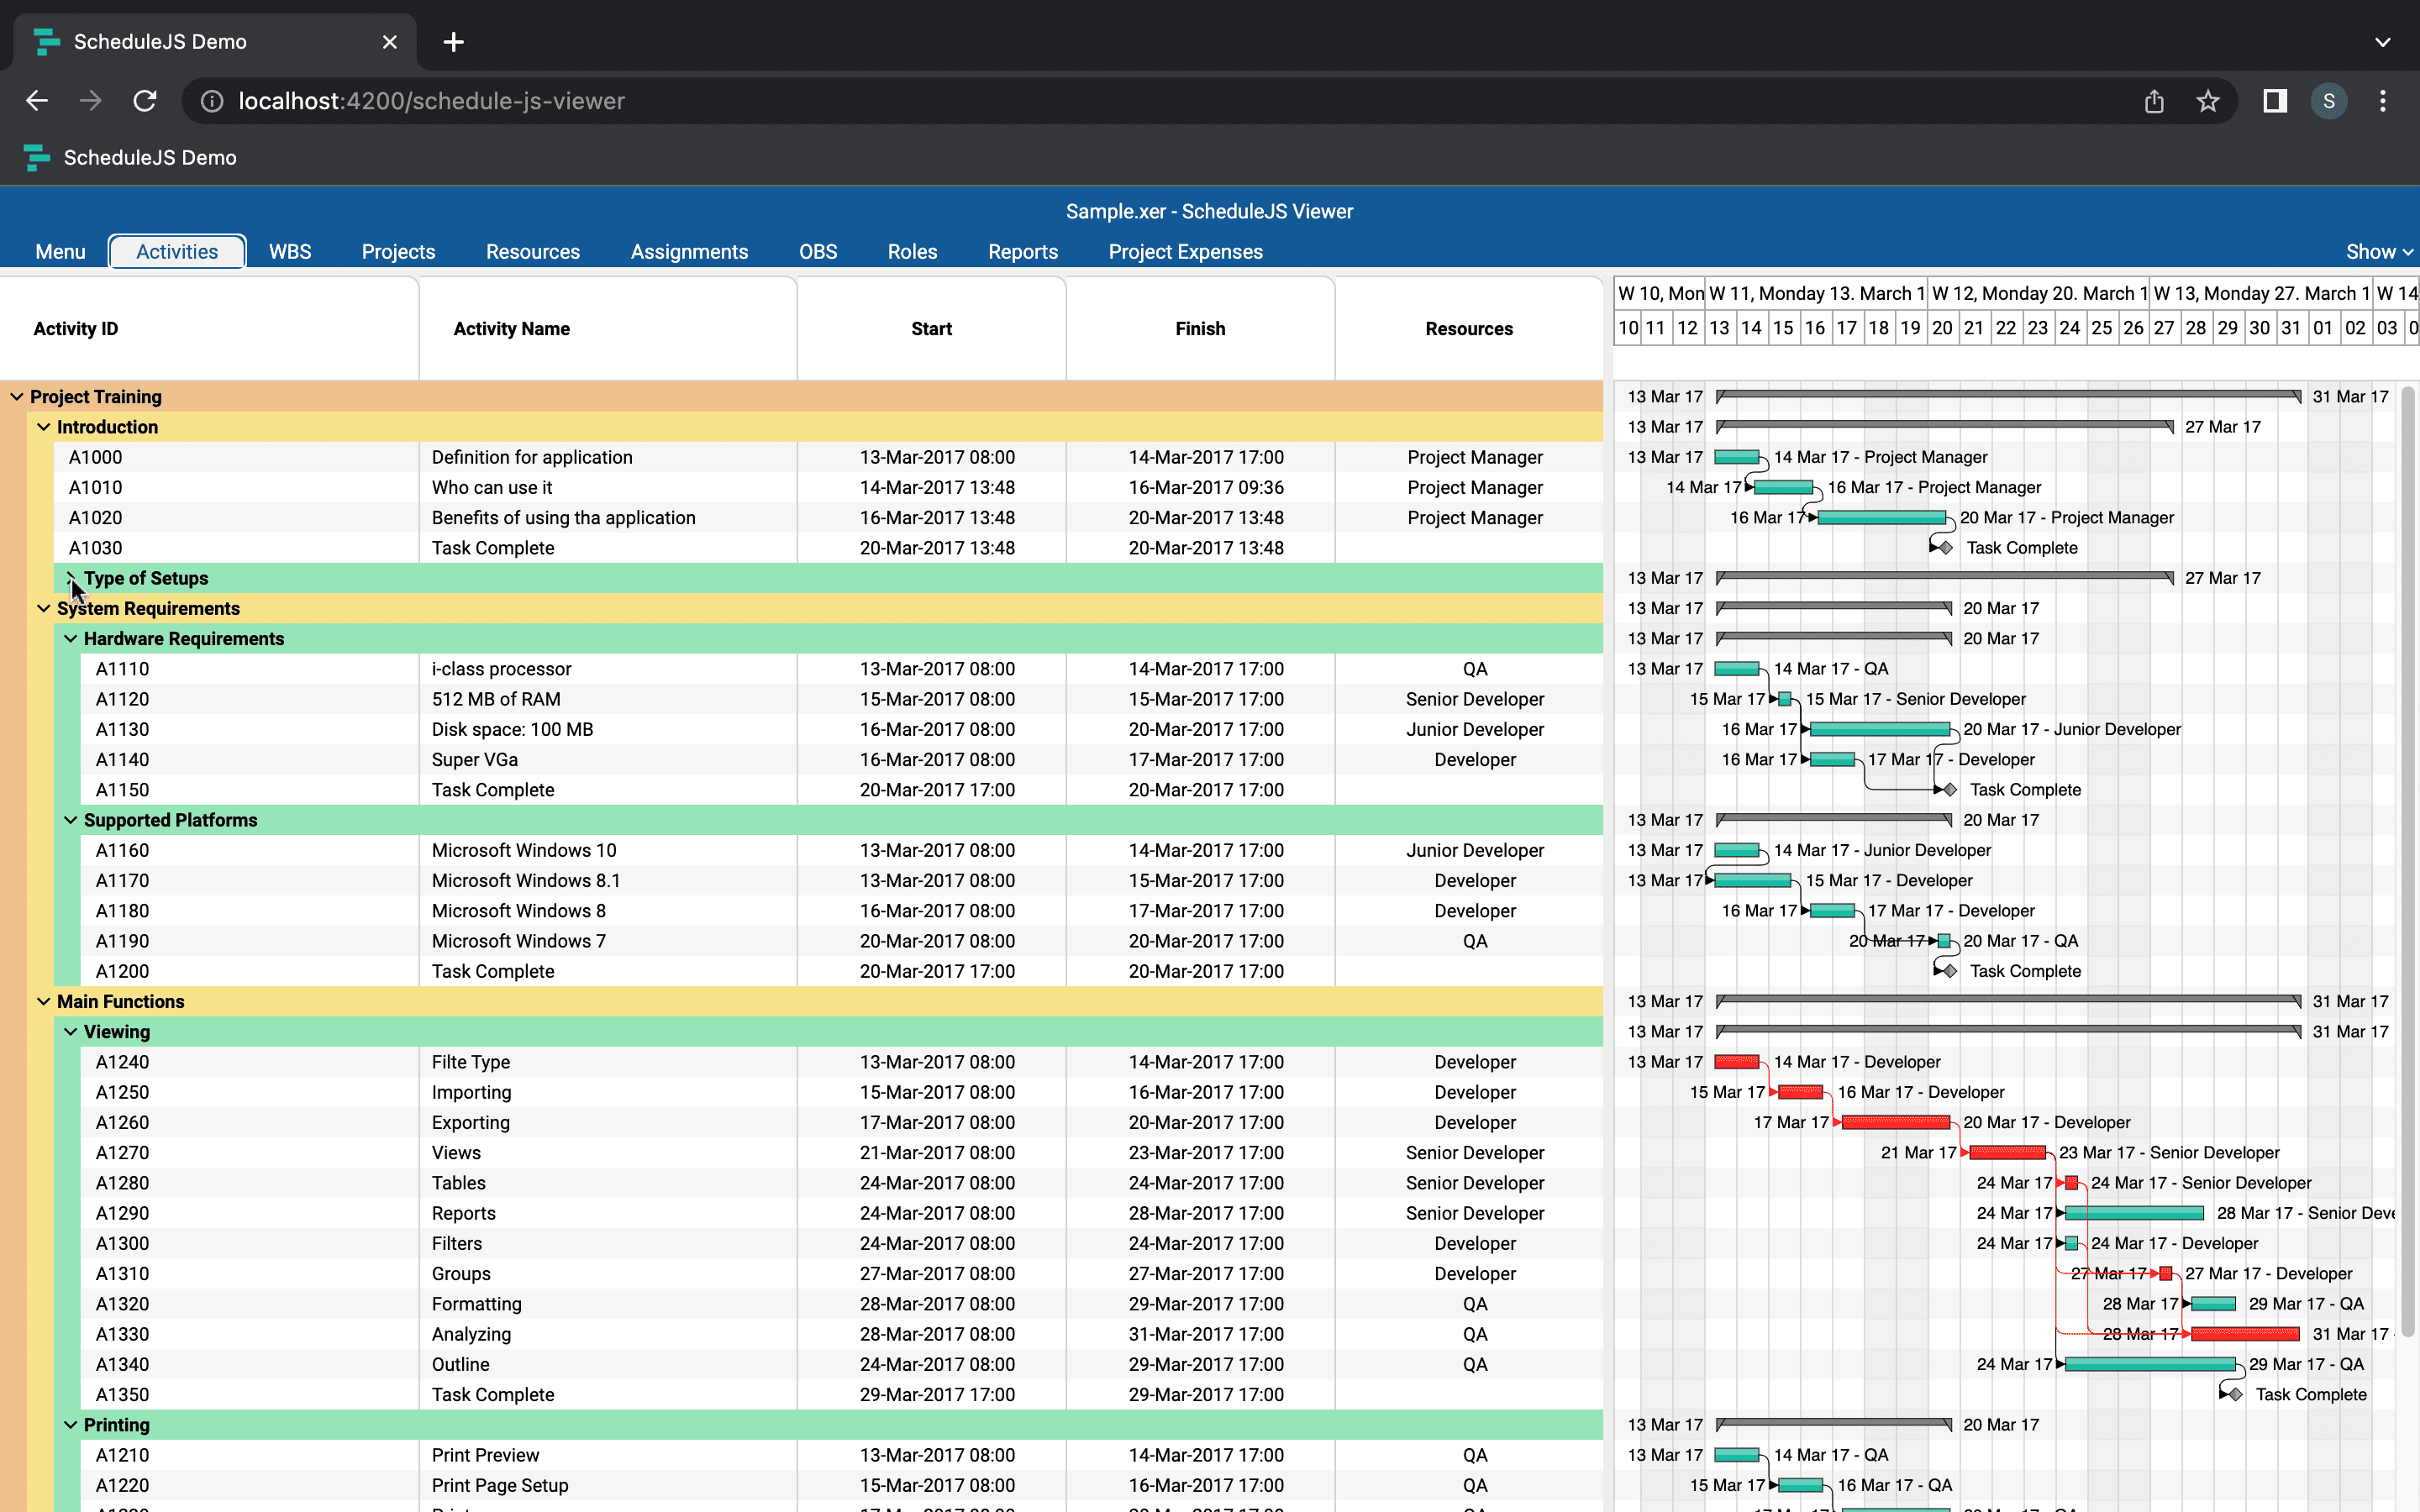
This article will showcase how the main activity renderer of the ScheduleJS Viewer was built with code examples.
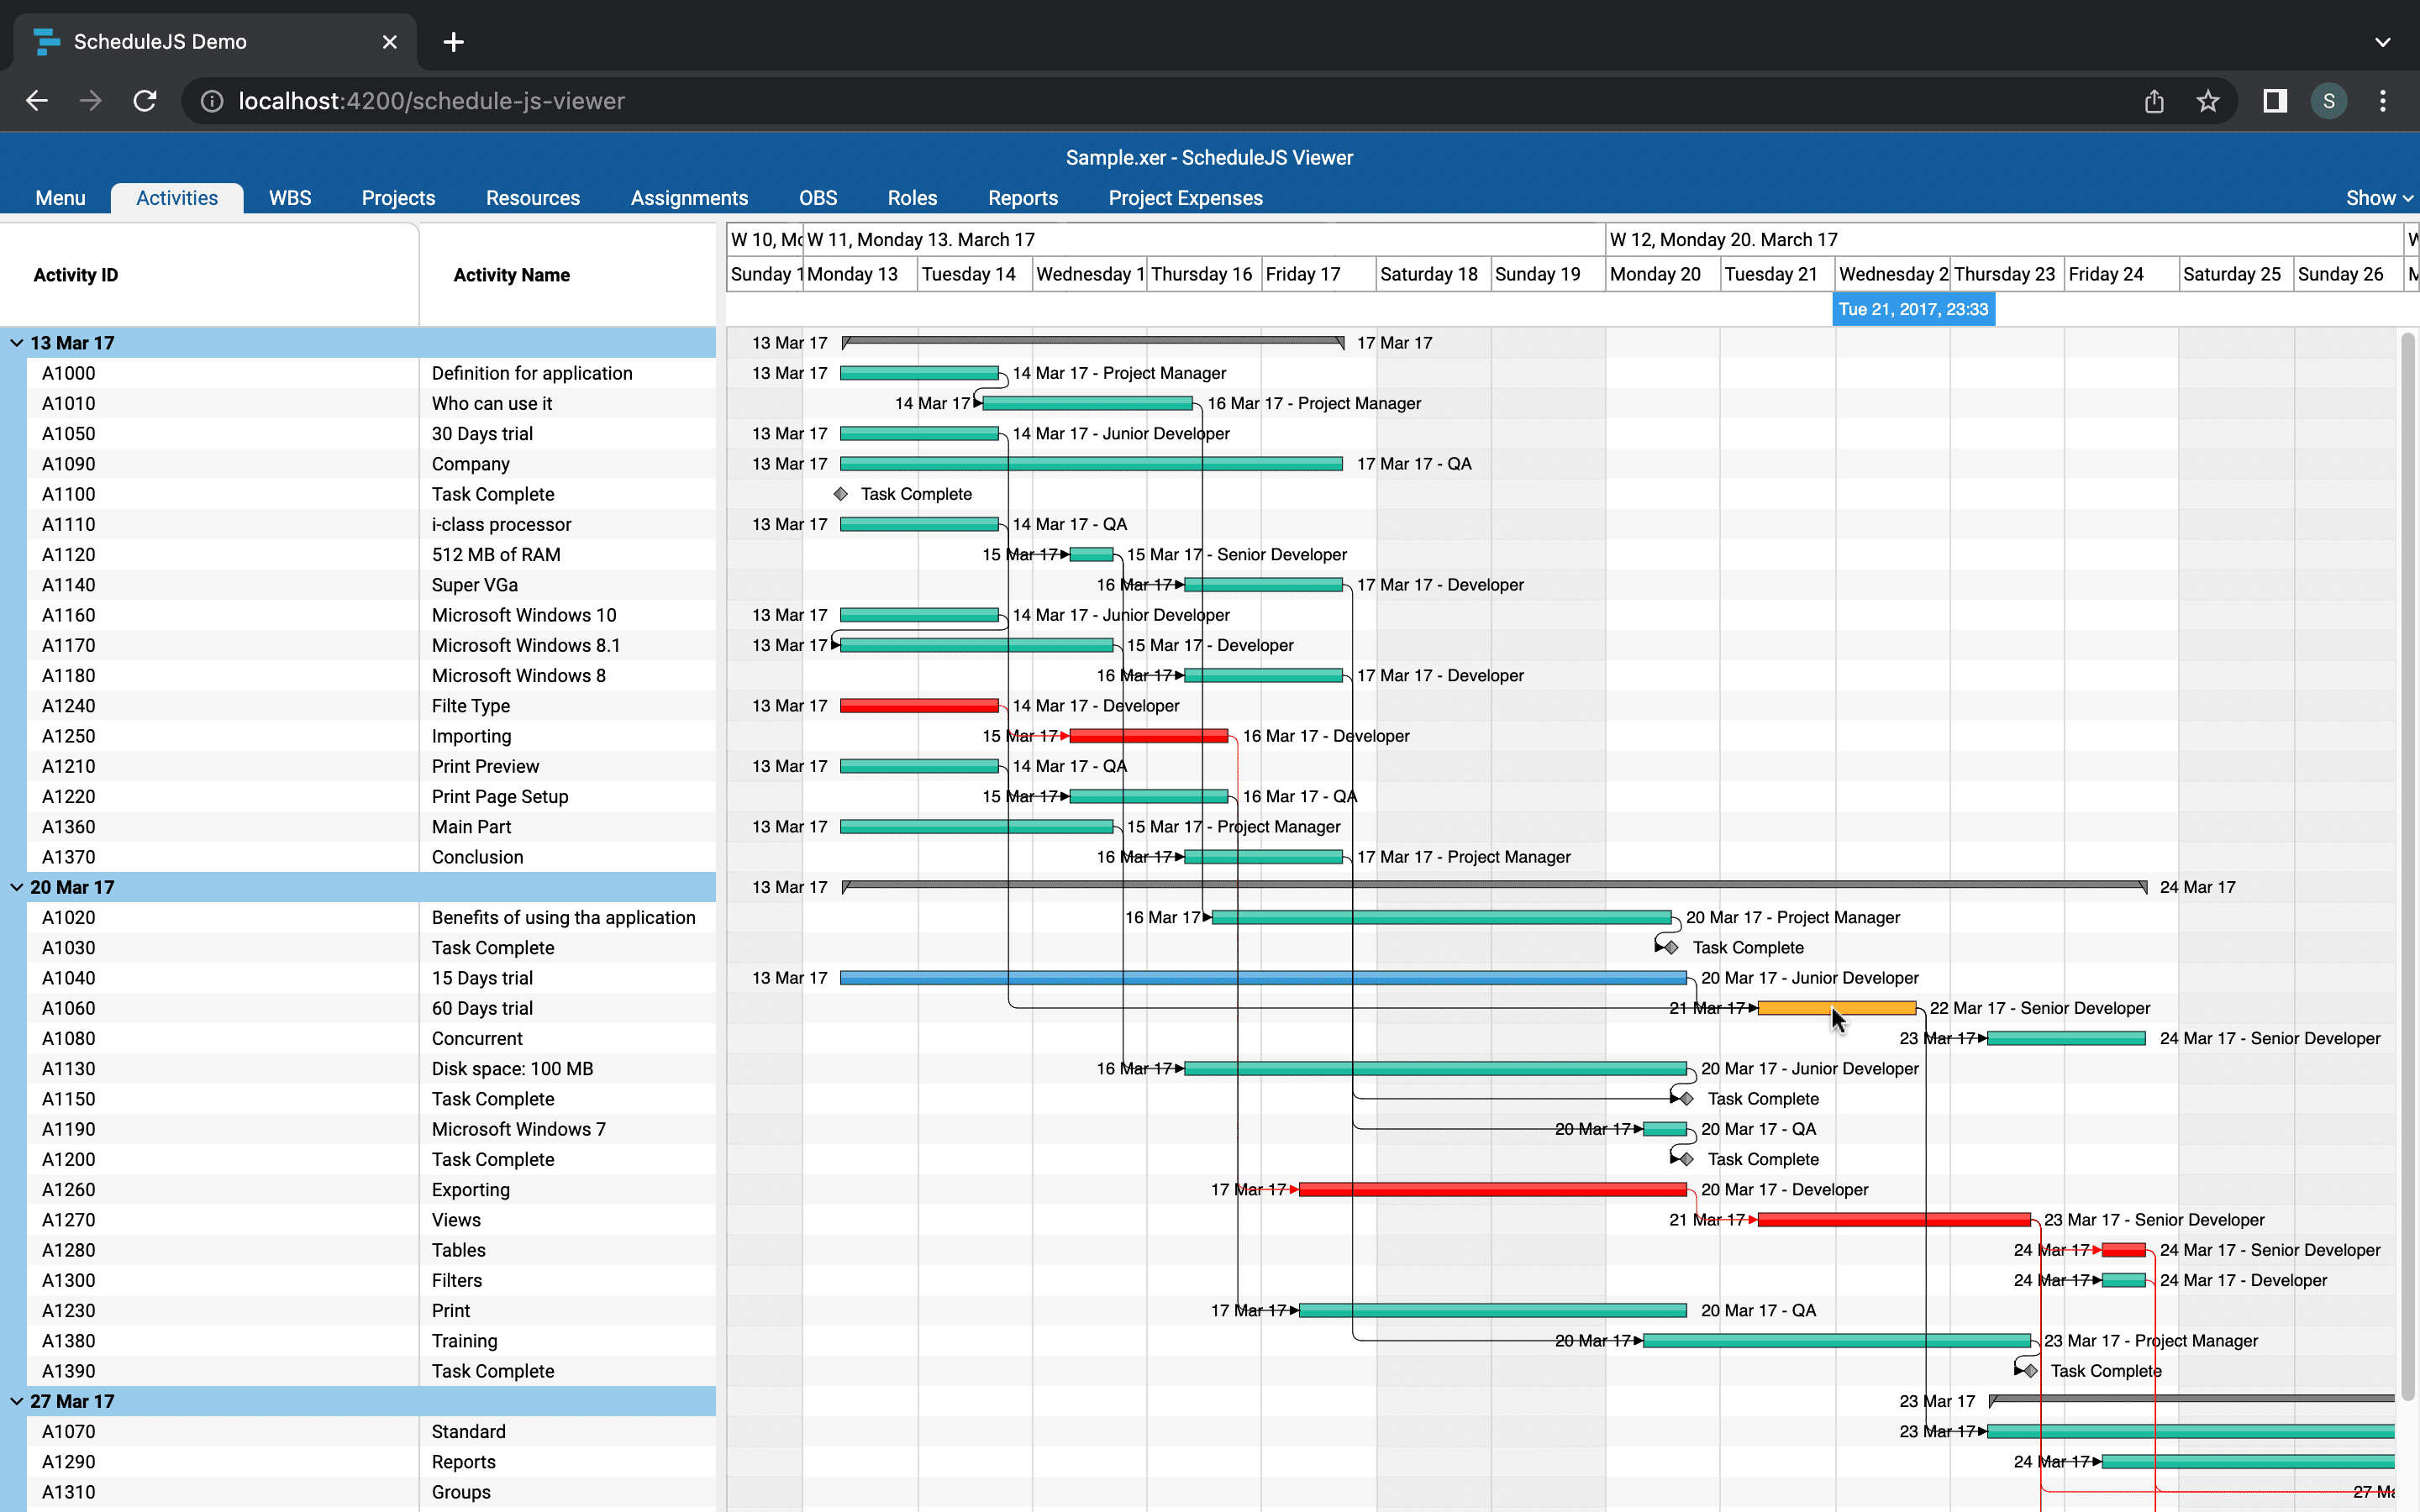
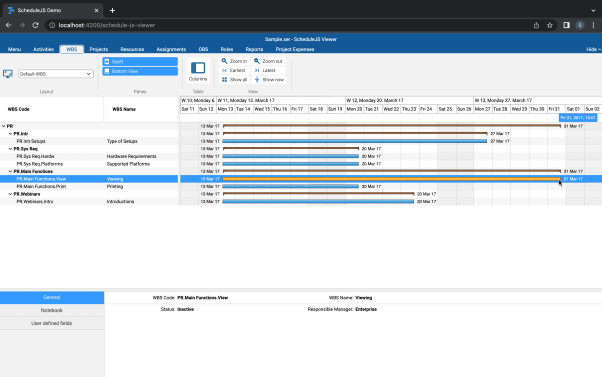
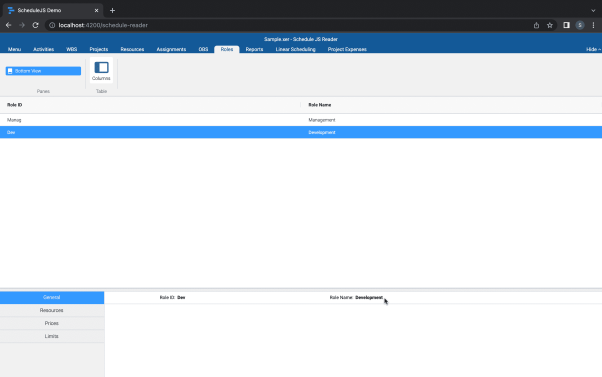
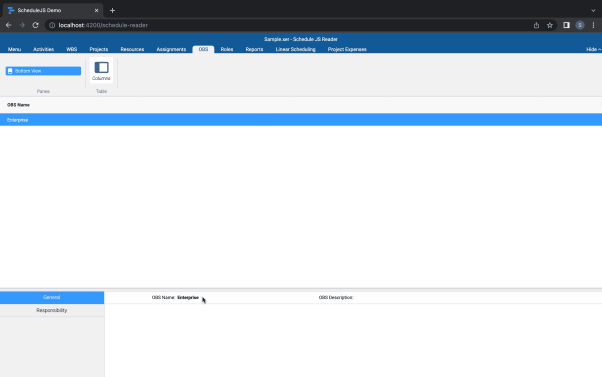
This article presents the main features included in the ScheduleJS Viewer. A brand-new web-based project viewer.

I appreciated the explanations of the different activity grouping options and the additional screens available in the ScheduleJS Viewer. It seems to be a complete tool for managing projects efficiently.
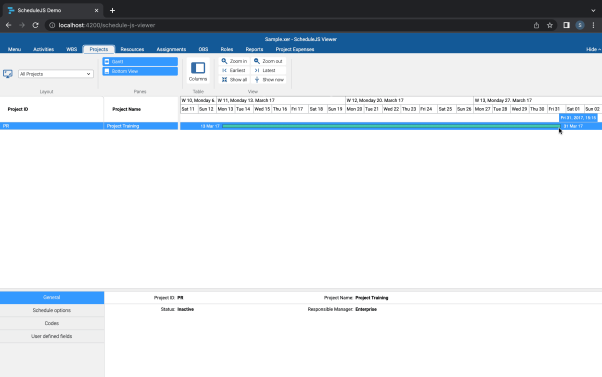
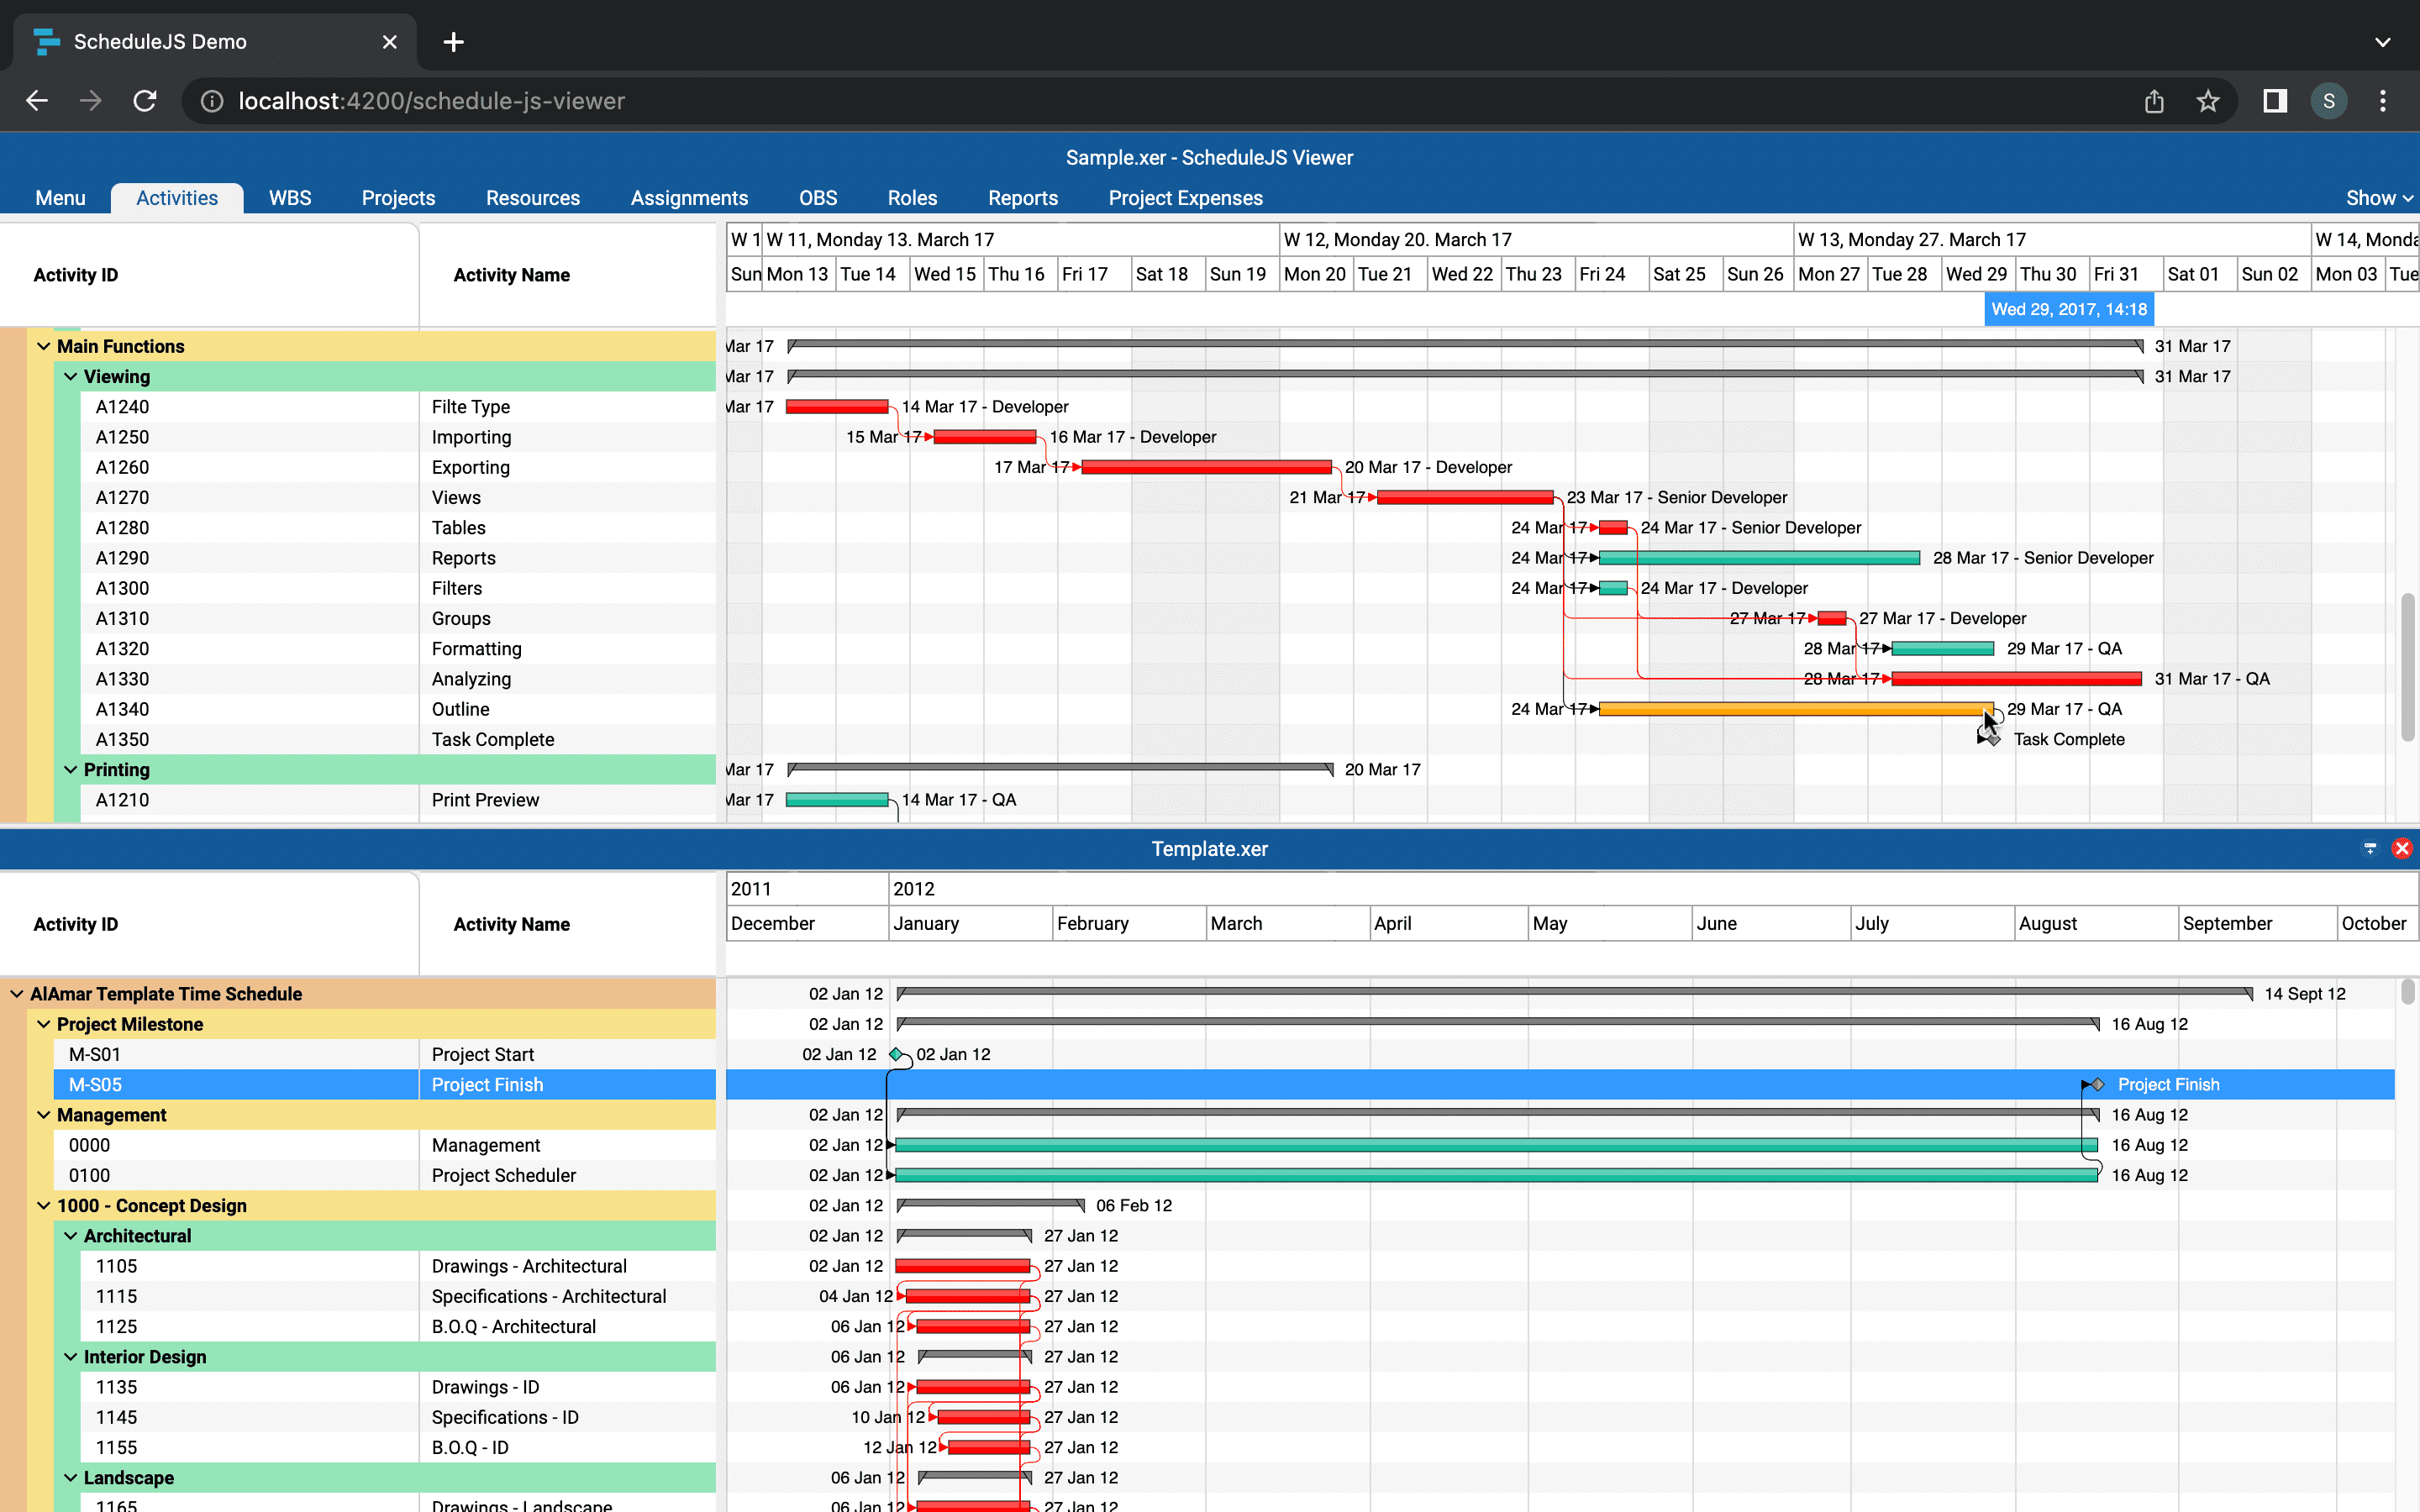
The activity and assignment screens seem to be very useful for visualizing project data. But how does the functionality for resizing simultaneously open projects work ?