4.1.3 - HighLowChartActivity
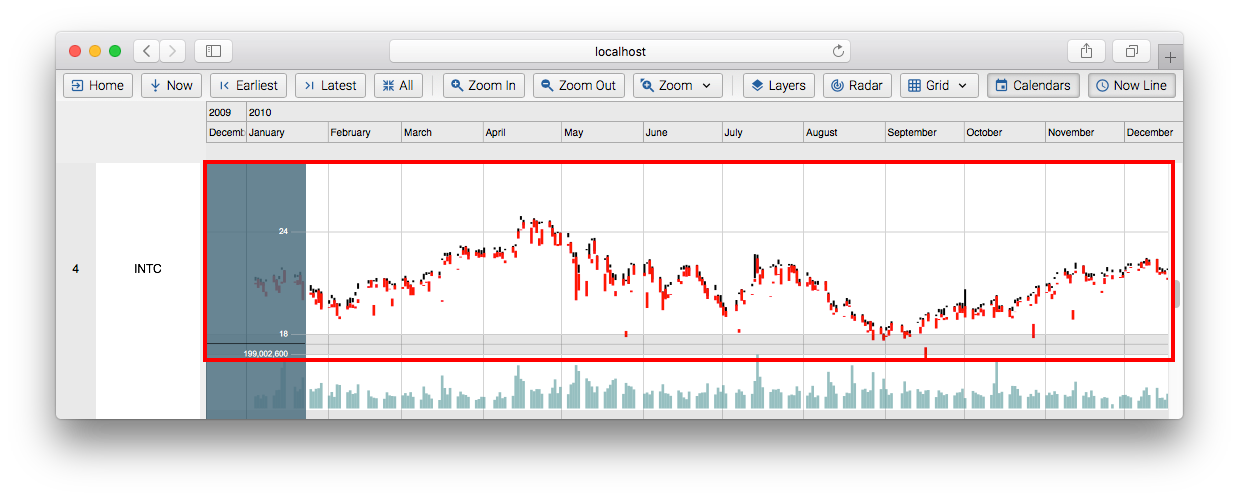
A high low chart activity carries two extra attributes: high and low. These values are used by the ChartLayout to position them appropriately. One use case for high low activities are candlestick charts like in the example below representing stocks open, high and low and close prices.